
Backstory
Cleartrip is an online travel booking platform that was founded in India but now also operates in the Middle East and Northern Africa regions. Approximately 10 million users visit the platform frequently to book flight tickets, hotel reservations, railway tickets, and local experiences. It is available on all major platforms – namely iOS (iPhone and iPad), Android, and the web.
The Situation
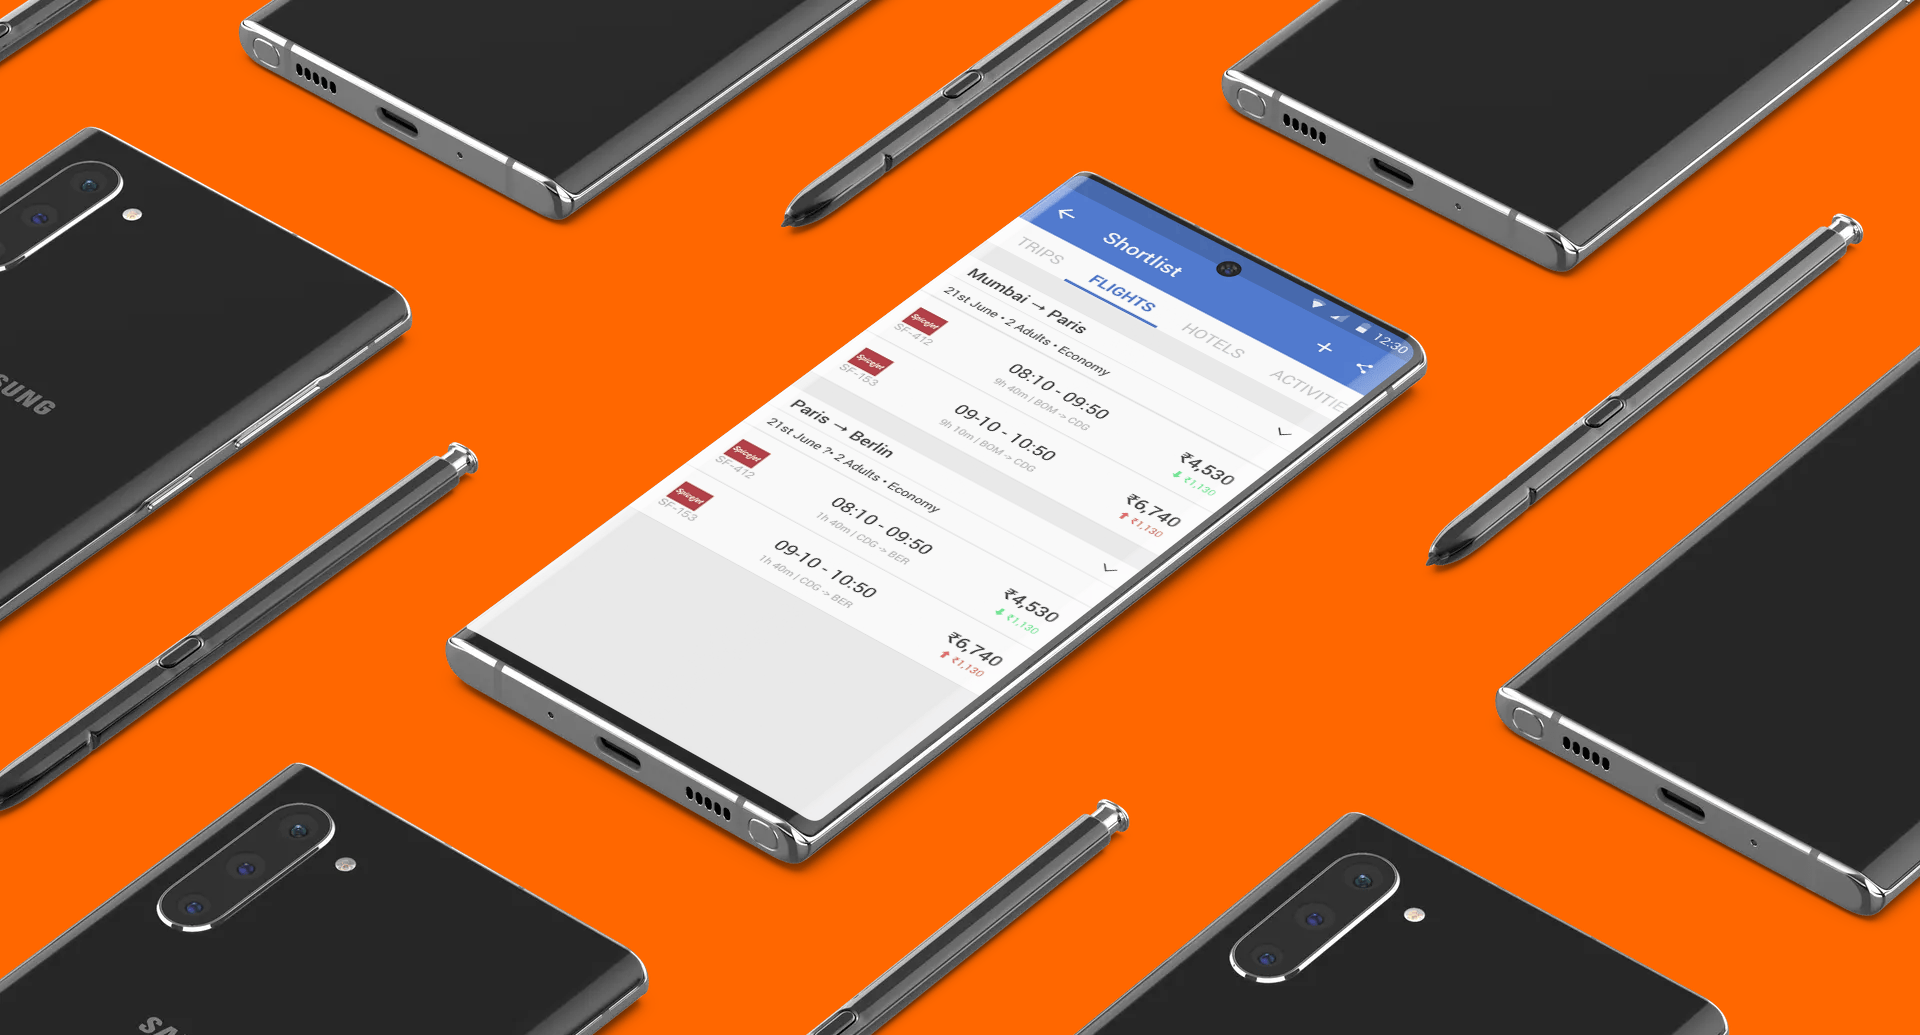
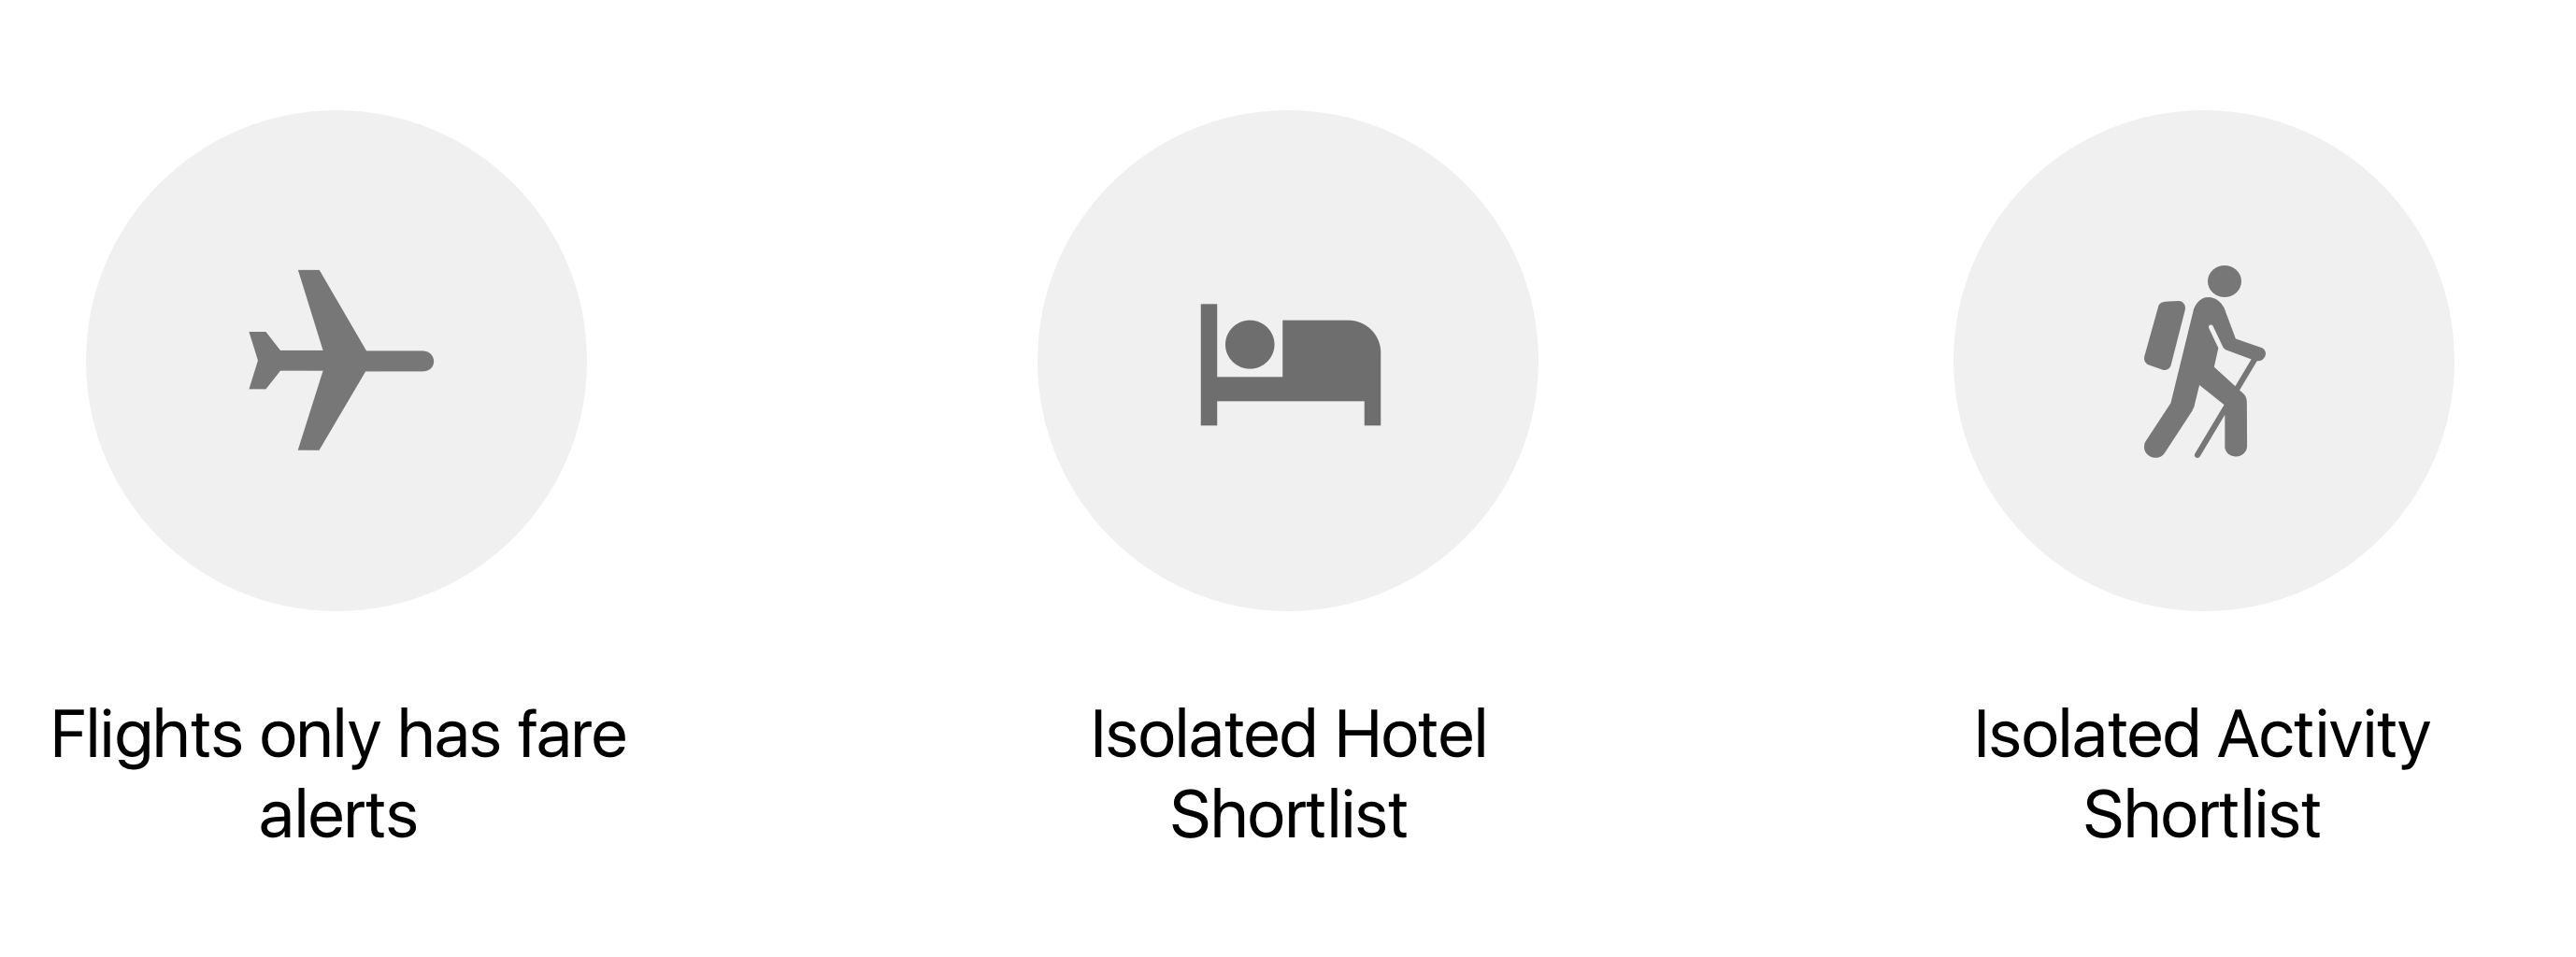
Cleartrip helps customers book flights, hotels, and activities. The existing app had separate hotels & activities shortlists, while the flights sector only had fare alerts (notifications when the cheapest flight changes its price). A product manager came to us with the idea of introducing a Flights shortlisting feature to add consistency across the product.
Solution
An end to end trip planning hub.
- Redesigned the trip planning experience by combining three different product offerings.
- Feature went live for more than 10 million+ users.
- Observed 17.6% conversion rate from shortlists to booked itineraries.
Research
As we dived deeper into the specifics of the task, we noticed the disconnect in the current mental model of the Shortlists feature.
For example, a customer could shortlist a hotel to a city, and also look for activities in the same place. So why were these two lists completely isolated from each other?
Journey Mapping
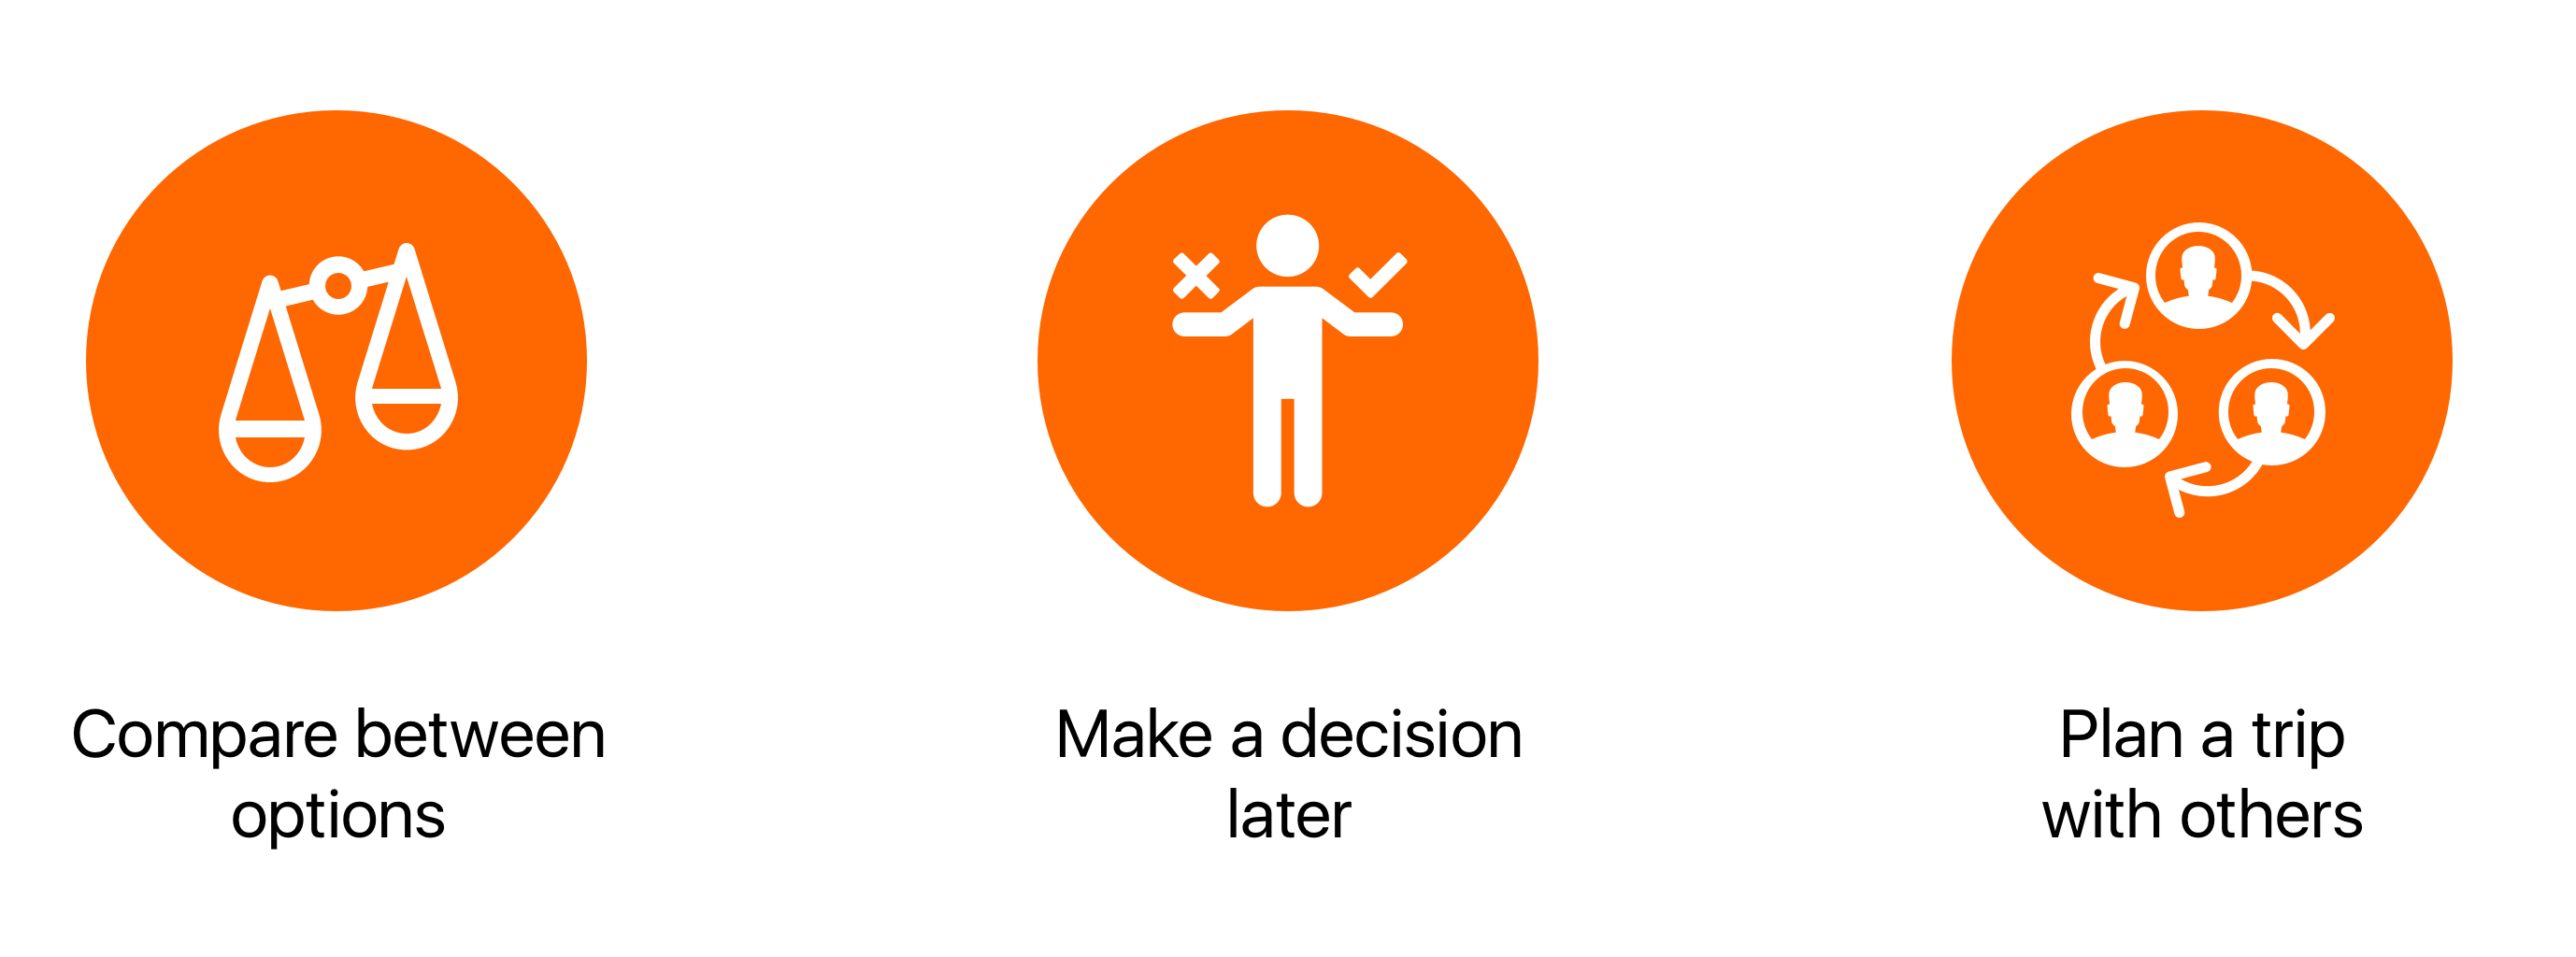
After conducting a few user interviews, we synthesized the data to form a journey map consisting of stages, actions, and opportunities associated with the process.
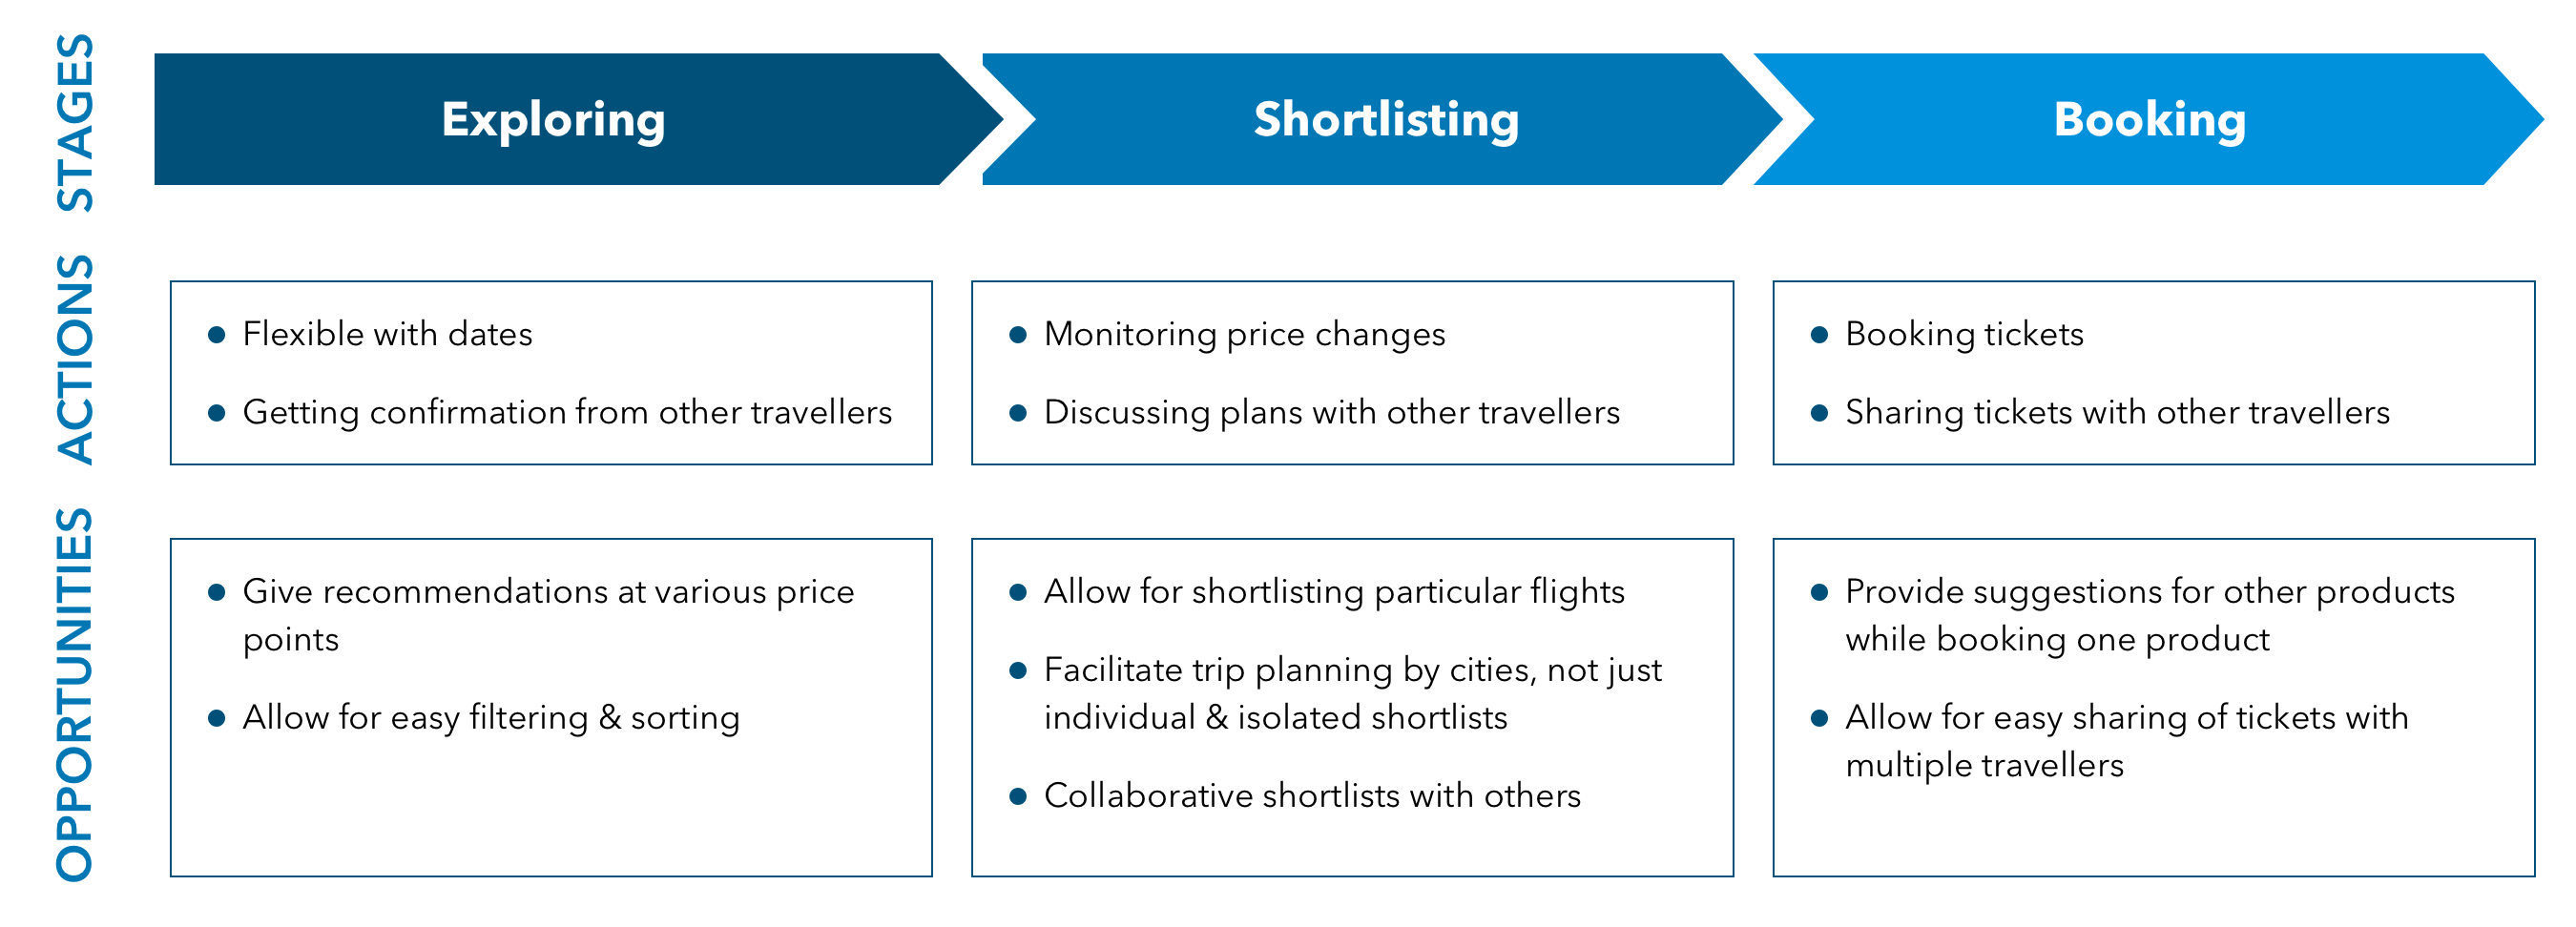
We realized that the app was pretty robust when it came to the Explore and Booking stages, but lacked functionality in the shortlisting phase.
Design
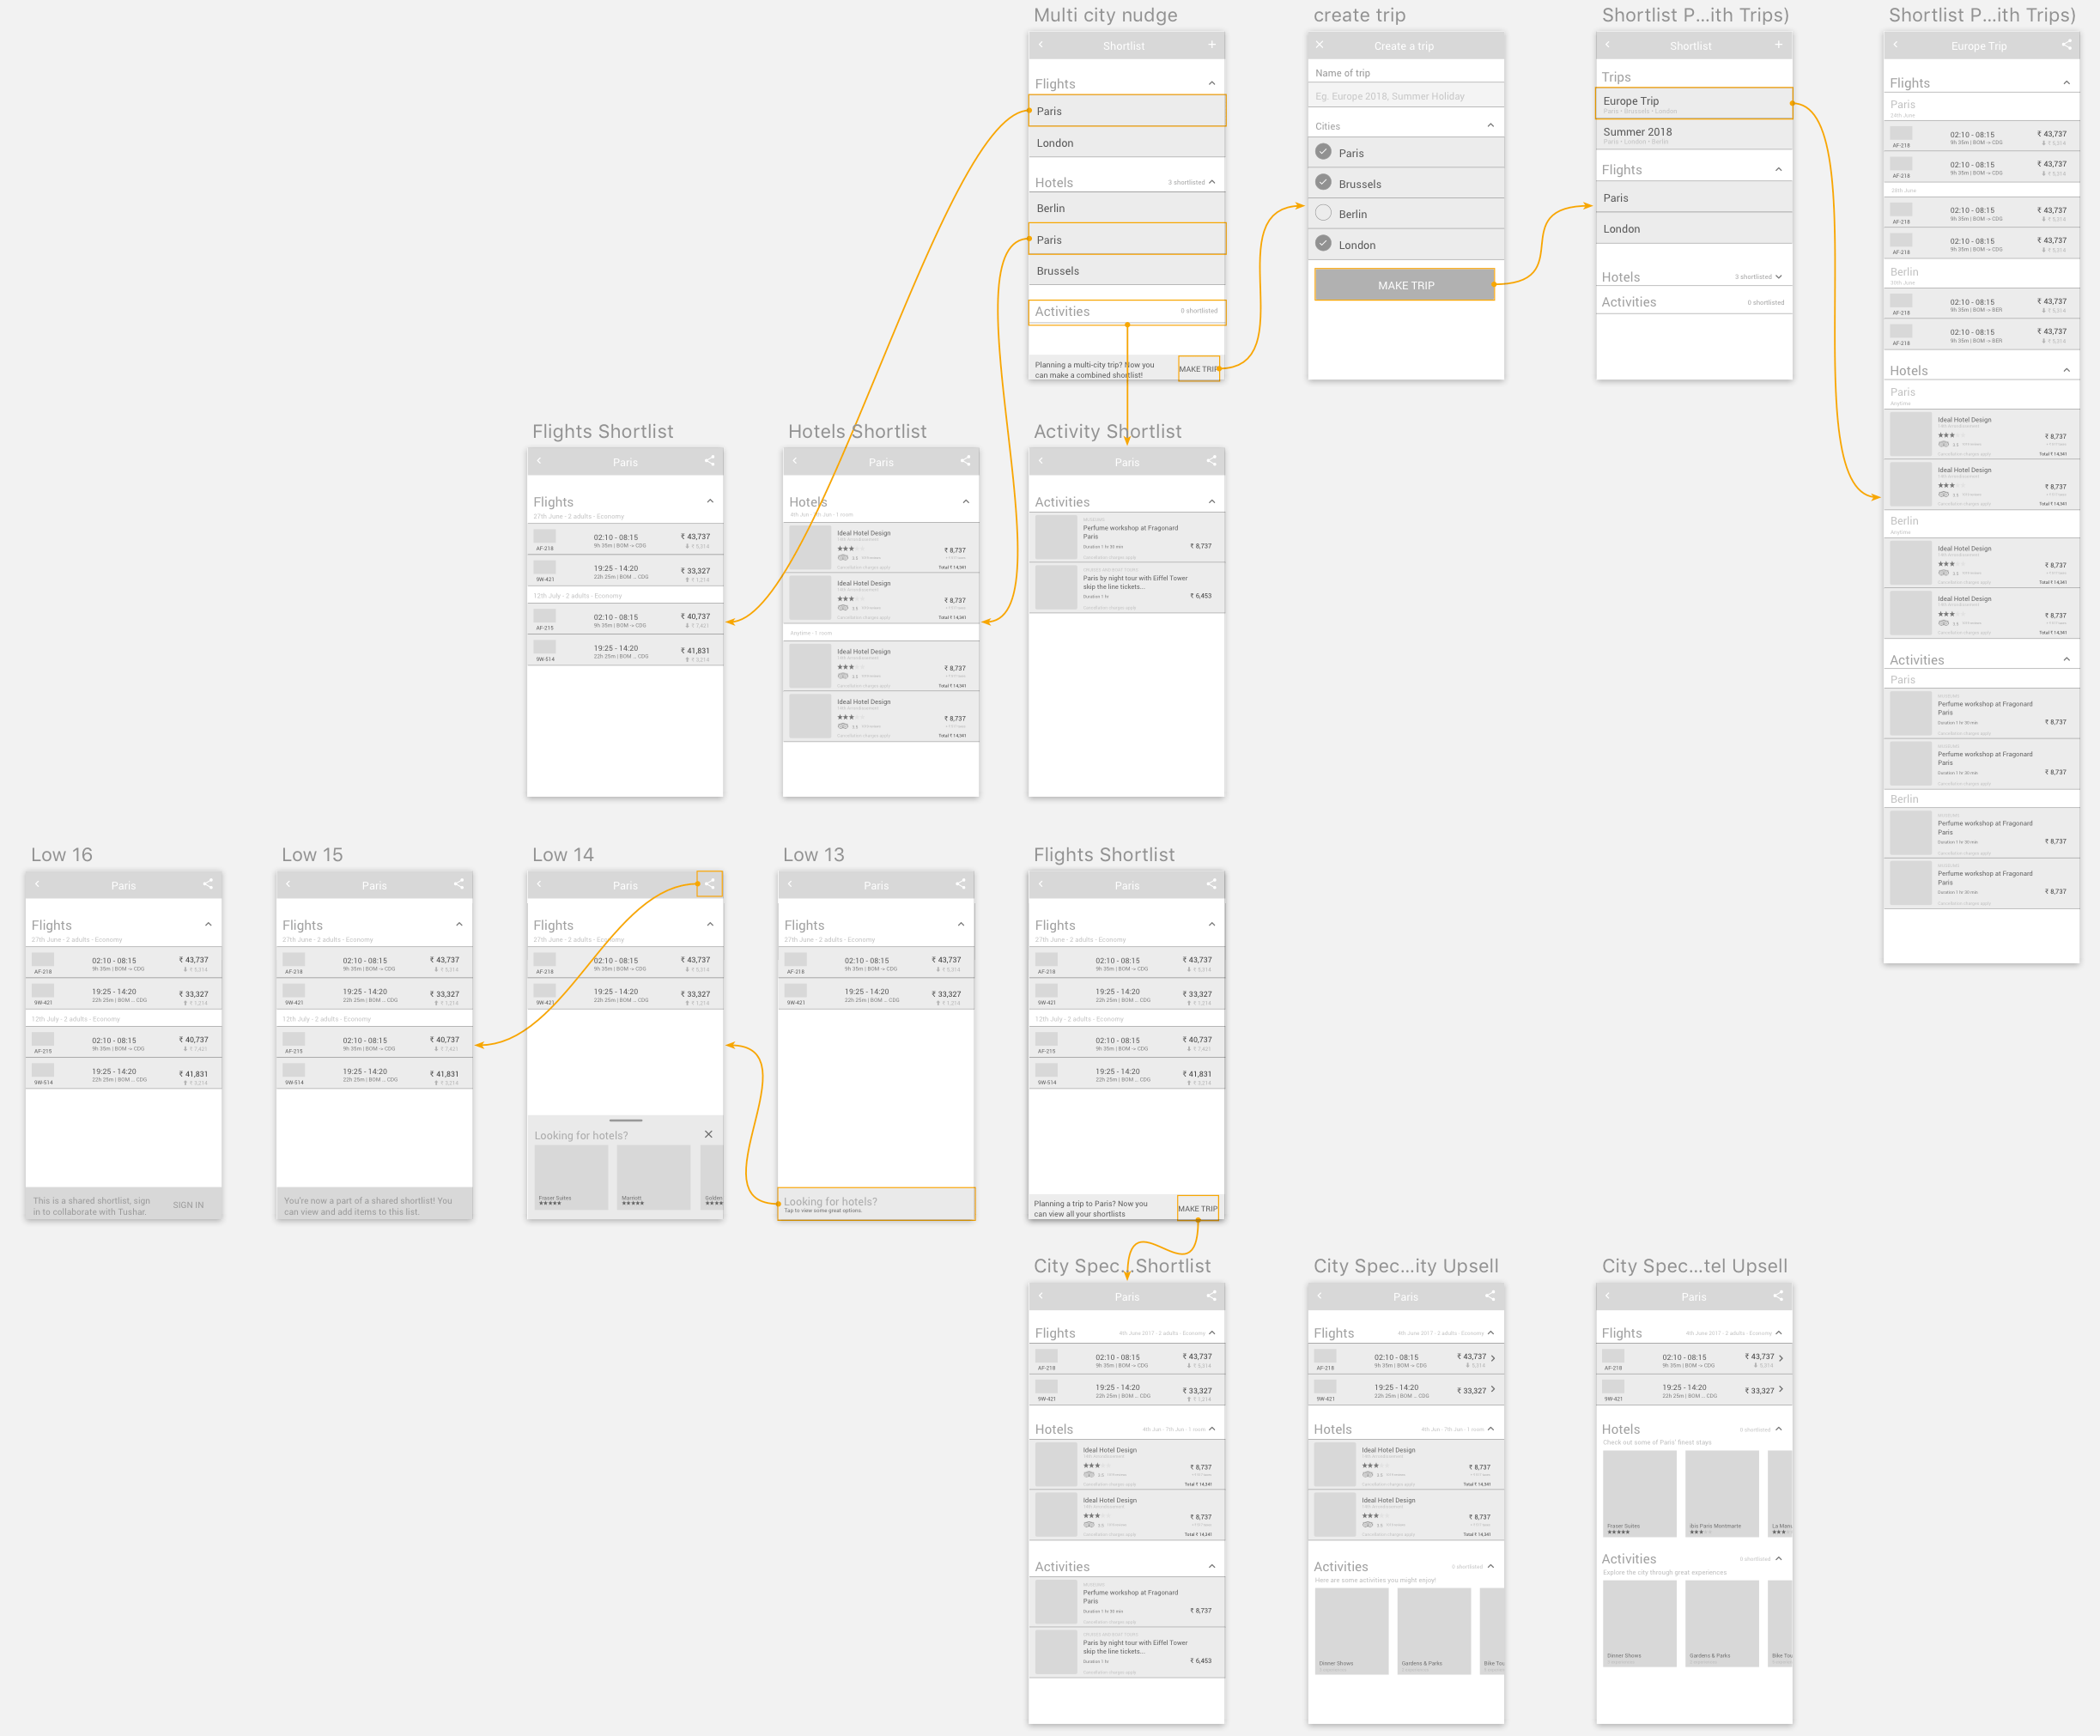
Design Explorations
Figuring out the hierarchy.
- The first alternative considered trips to be on the same level as sector specific shortlists.
- This helped in ensuring consistency no matter where the user accessed the page from.
Placing more emphasis on trips.
- The second alternative placed a higher emphasis on trips by making it a richer card with the addition of an image related to that city/country.
- Though it conveyed that trips were higher in the hierarchy, if the user had planned multiple trips, the image card would take up a lot of the available height, reducing the amount of information which can be displayed at first glance.
The winning design.
- Iterating on these ideas led us towards an interface which used a tabbed navigation, with Trips being the first tab followed by swipe gestures to reach the other sectors.
- This also meant that when a user tapped the Shortlists icon from any sector's page, it would take them to that tab directly. This ensured consistency while educating users about how trips could assist them with the itinerary planning process.
Cross selling nudges.
- The nudges were made to tackle the problem statement directly, allowing for smart suggestions to customers who had shortlisted other sections to a city.
- Three suggestions at three different price points are shown with an option to see more.
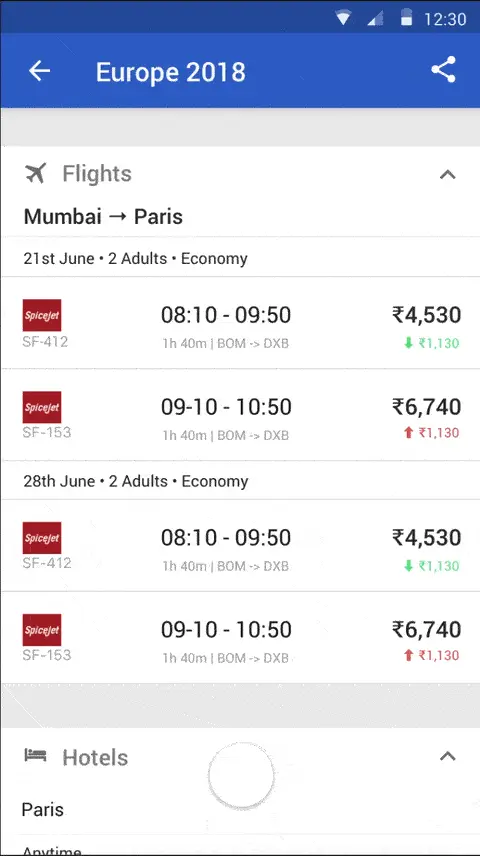
Trip View

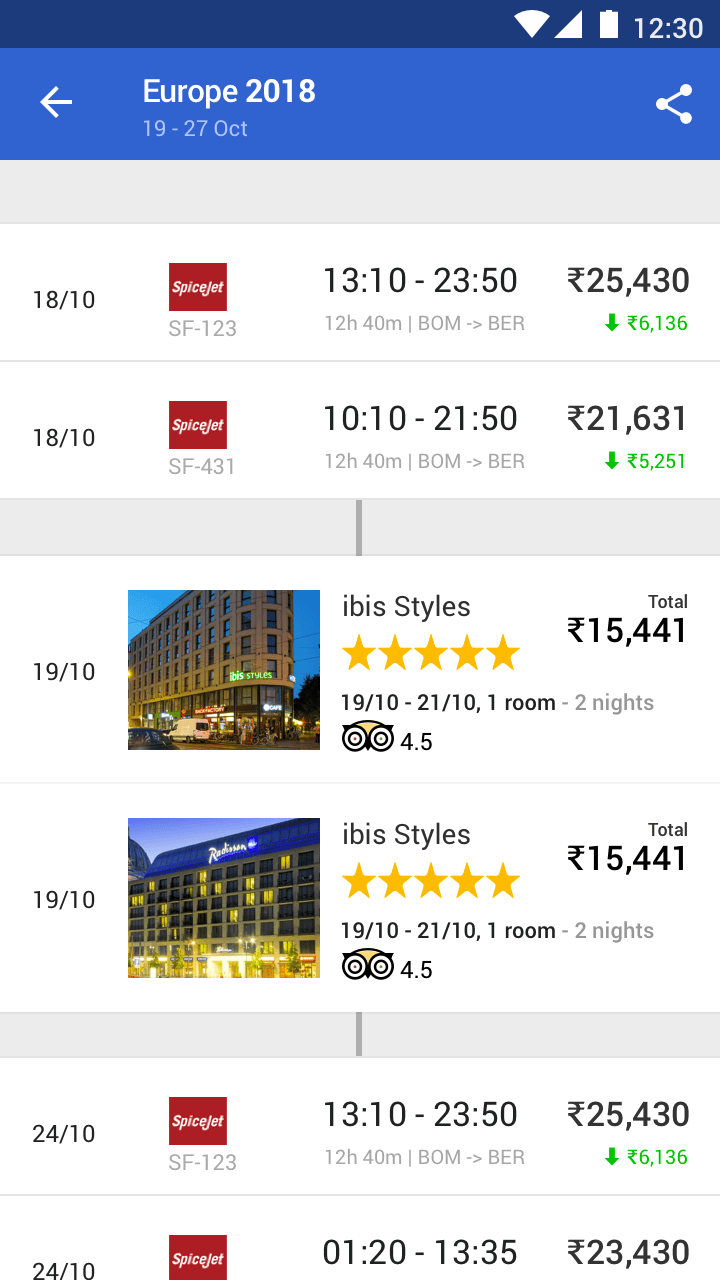
Chronological timeline
The major advantage of Exploration 1 was that it followed a temporal order of the trip, but the disadvantages included a lot of redundant information on each card which could be grouped together to reduce information overload. Moreover, this design was drastically different from any design patterns currently being used in the app.
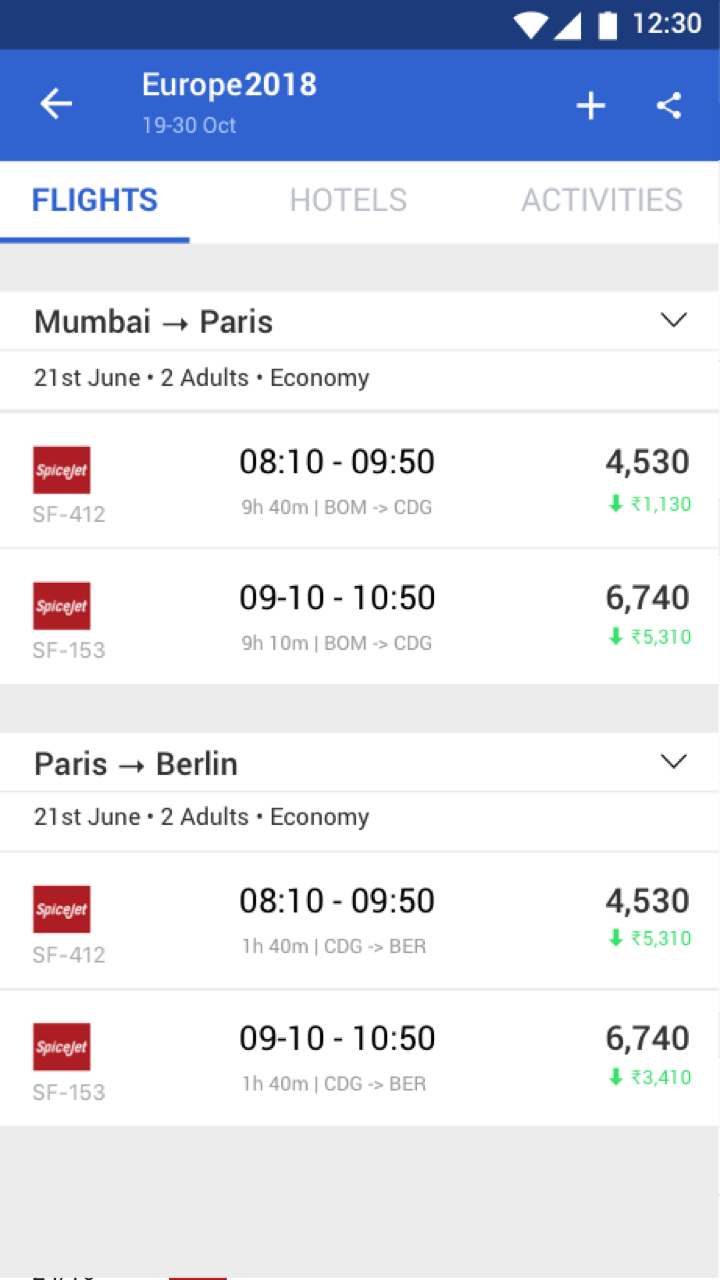
Sector Tabs
We also explored re-using the nested tab navigation from the top-level screen, but based on the feedback from the senior designers – we realized that the removal of the 'Trips' tab between the two pages could lead to confusion and would be inconsistent. Additionally, this layout gives rise to a potential confusion about what happens when the 'Share' icon is tapped – does it only share the 'Flights' of the shortlist, or the entire shortlist?
Finding the sweet spot
The direction we ended up going for was a long scroll with collapsible cards. This allowed for easy comparison by grouping common info and fixed the mental model issue of sharing a 'trip' vs just sectors.
Shortlisting Flights
Tap to Like
The most obvious way was to have heart icons on each flight list item. Even though this would probably have the best engagement rates, after discussions with my design mentor, we ruled this possiblity out due to the added clutter to an existing list item, and due to the plethora of information already needed to digest on each element.
Double tap for familiarity
Another option was to allow for double tapping each list item to allow for shortlisting. This was done keeping familiarity of this micro-interaction in mind, but while discussing these alternatives, we got feedback that users might not be able to associate such a micro-interaction to shortlisting/liking on an app they usually open once in every few months.
Swiping for more
The direction we finally went towards was using a swipe gesture to shortlist flights. At first, we were concerned about the learning associated with using a new micro-interaction, but thought nudges and tutorials – our hypothesis was that it could be taught. The goal was to measure engagement rates during a beta rollout and validate our assumptions.
Outcomes
- My work achieved product and business buy-in, and was being planned to be shipped towards the end of my internship.
- The adoption rate for this redesign was around 4.6% (in the first few weeks) with 17.4% of the customers converting to booked tickets from the Shortlists tab.
- To put these numbers into perspective, most features that require interaction in comparison have adoption rates of less than 1% during the first few weeks.
Learnings
- Designing for millions of users means removing inherent biases and using data to make decisions.
- Rushing to the high fidelity stage might be tempting, but most of the work is everything that happens before that step.
- Design can never be an isolated process. Product & Business teams can give great insight into the features you're working on. Be sure to involve them.